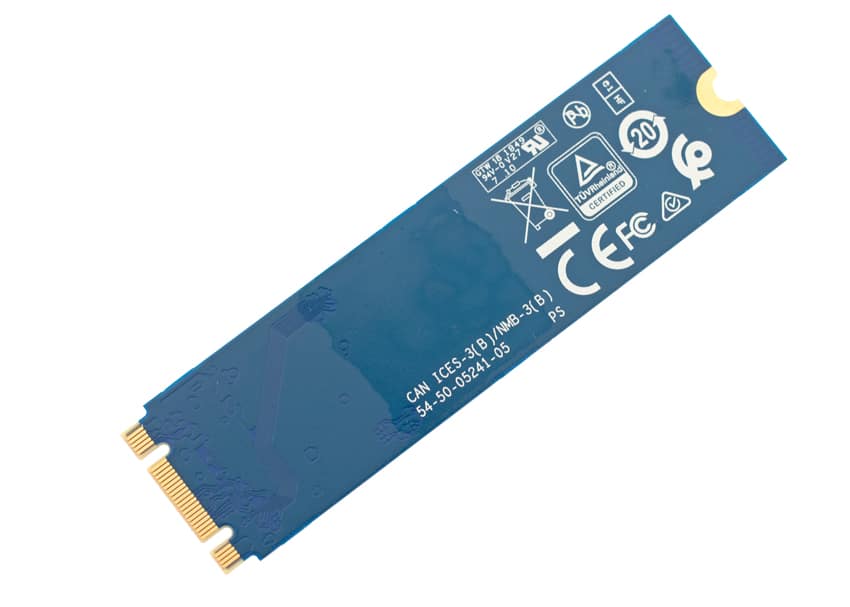
The WD Blue SN500 NVMe SSD, announced mid-March, is the first SSD in the WD Blue family that utilizes NVMe technology, whereas the previous WD Blue models used SATA technology. The WD Blue SN500 is an M.2 form factor, consumer-focused, entry point NVMe SSD, ideal for those looking to gain a performance boost by upgrading from their HDD or older SATA SSD.
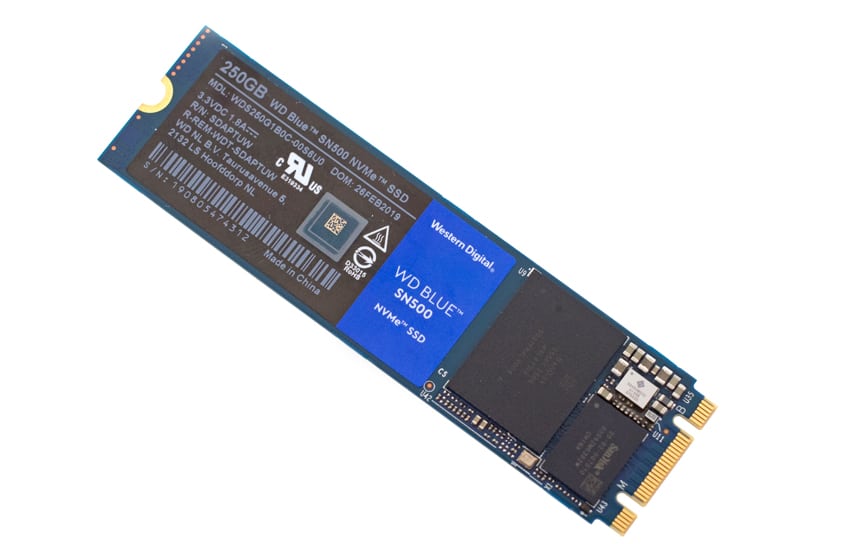
In terms of performance, WD makes the claim that the WD Blue SN500 NVMe makes an impressive performance jump of three times that of the high-end SATA SSDs. WD quotes (for the 500GB model) sequential read speeds of up to 1,700MB/s, while sequential write speeds are quoted at up to 1,450MB/s.
WD seems to have made a good move in eliminating the price disparity between SSDs and HDDs. The 250GB version costs only $53.99, while the 500GB version is priced at $75.99. In this review, we will be looking at the 250GB model.
WD Blue SN500 NVMe SSD Specifications
| Interface | PCIe Gen3 8Gb/s, up to 2 lanes |
| Capacities | 250GB; 500GB |
| Performance | Sequential Read MB/s: 1,700;1,700 Sequential Write MB/s: 1,300;1,450 Random Read IOPS: 210K; 275K Random Write IOPS: 170K;300K |
| Endurance (TBW) | 150; 300 |
| Power | Average Active Power (mW): 75;75 Low Power (PS3) (mW): 25;25 Peak Power (10us): 1.8A; 1.8A Sleep (PS4) (low power): 2.5mW; 2.5mW |
| MTTF | 1.75M hours |
| Environmental | Operating Temperature: 0oC to 70oC; 0oC to 70oC Non-operating Temperature: -55oC to 85oC; -55oC to 85oC Operating Vibration: 5.0 gRMS, 10-2,000 Hz, 3 axes; 5.0 gRMS, 10-2,000 Hz, 3 axes Non-Operating Vibration: 4.9 gRMS, 7-800 Hz, 3 axes; 4.9 gRMS, 7-800 Hz, 3 axes Shock: 1,500 G @ 0.5 ms half sine; 1,500 G @ 0.5 ms half sine |
| Physical Dimensions | Form Factor: M.2 2280 Length: 80 ± 0.15mm Width: 22 ± 0.15mm Height: 2.38 ± 0.15mm Weight: 6.5 ± 1g |
Performance
Testbed
The test platform leveraged in these tests is a Dell PowerEdge R740xd server. We measure SATA performance through a Dell H730P RAID card inside this server, although we set the card in HBA mode only to disable the impact of RAID card cache. NVMe is tested natively through an M.2 to PCIe adapter card. The methodology used better reflects end-user workflow with the consistency, scalability and flexibility testing within virtualized server offers. A large focus is put on drive latency across the entire load range of the drive, not just at the smallest QD1 (Queue-Depth 1) levels. We do this because many of the common consumer benchmarks don’t adequately capture end-user workload profiles.
Houdini by SideFX
The Houdini test is specifically designed to evaluate storage performance as it relates to CGI rendering. The test bed for this application is a variant of the core Dell PowerEdge R740xd server type we use in the lab with dual Intel 6130 CPUs and 64GB DRAM. In this case we installed Ubuntu Desktop (ubuntu-16.04.3-desktop-amd64) running bare metal. Output of the benchmark is measured in seconds to complete, with fewer being better.
The Maelstrom demo represents a section of the rendering pipeline that highlights the performance capabilities of storage by demonstrating its ability to effectively use the swap file as a form of extended memory. The test does not write out the result data or process the points in order to isolate the wall-time effect of the latency impact to the underlying storage component. The test itself is composed of five phases, three of which we run as part of the benchmark, which are as follows:
Loads packed points from disk. This is the time to read from disk. This is single threaded, which may limit overall throughput.
Unpacks the points into a single flat array in order to allow them to be processed. If the points do not have dependency on other points, the working set could be adjusted to stay in-core. This step is multi-threaded.
(Not Run) Process the points.
Repacks them into bucketed blocks suitable for storing back to disk. This step is multi-threaded.
(Not Run) Write the bucketed blocks back out to disk.
Looking at the performance of rendering time (where less is better), the WD Blue SN500 found itself second from the bottom of the pack with a score of 4,458.1 seconds.
VDBench Workload Analysis
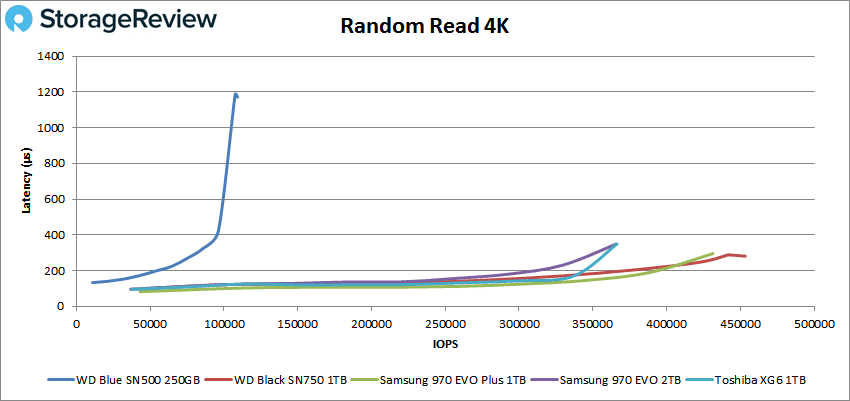
In our first VDBench Workload Analysis, we looked at random 4K read performance. Here, the WD Blue SN500 fell behind all other drives in small block random read performance, scaling from 942 IOPS with a 604.9μs latency and peak performance at 9,311 IOPS and a latency of 1,171μs.
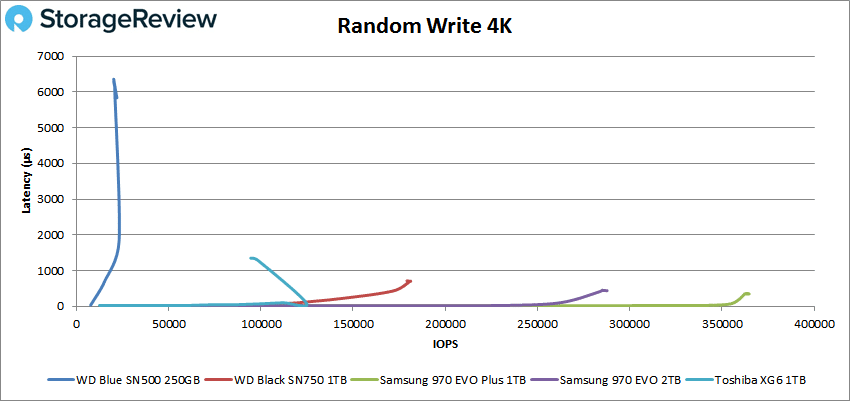
For 4K write, the WD Blue SN500 4For 4K write, the WD Blue SN500 placed last once again, kicking off the test with 7,708 IOPS at a 33.5μs latency and hitting a peak performance of 21,927 IOPS at a latency of 5,836μs.
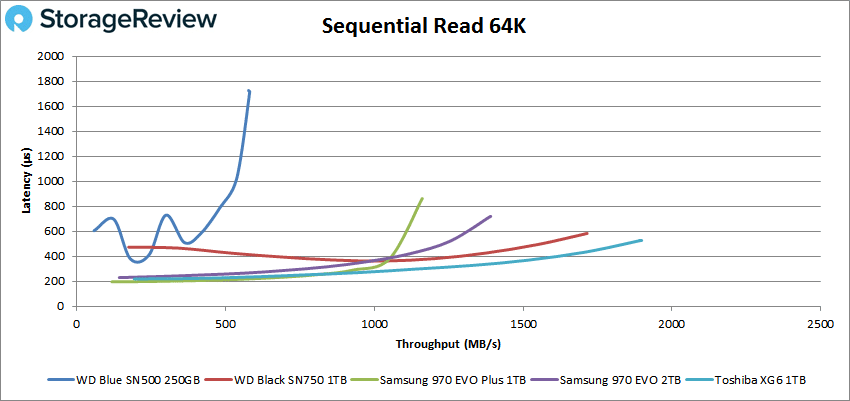
Switching over to sequential workloads in our 64K benchmarks, the WD Blue SN500 came in at the back of the pack, showing a performance of 9,293 IOPS (or 581.9 MB/s) with a latency of 1,717μs.
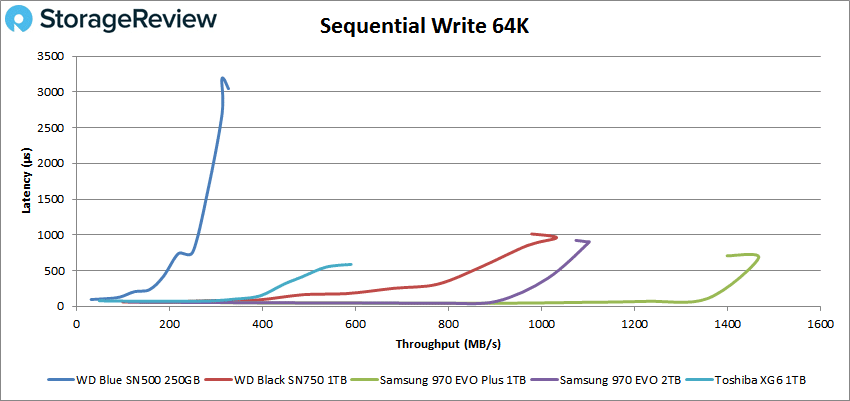
Looking at sequential 64K write, the WD Blue SN500 continued to follow its trend and placed last. Here, we saw a peak performance of 5,226 IOPS (or 326.6MB/s) with a latency of 3,046μs.
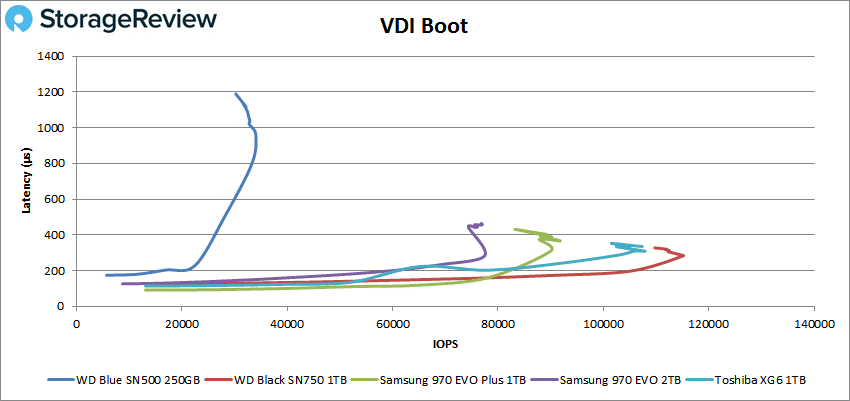
Next, we looked at our VDI benchmarks, which are designed to tax the drives even further. These tests include Boot, Initial Login, and Monday Login. Looking at the Boot test, the WD Blue SN500 started off the test with a latency of 174.2μs and went on to peak at 30,251 IOPS with a latency of 1,188μs. The drive held last place in both burst and peak.
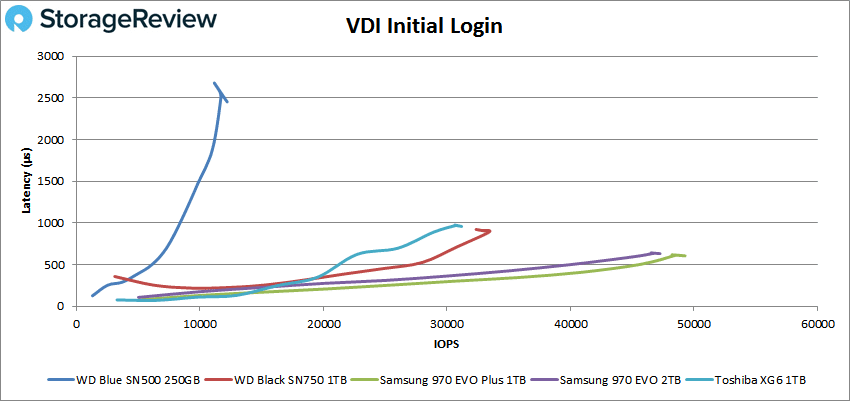
For VDI Initial Login, the WD Blue SN500 had the second highest latency, putting it ahead of the WD Black SN750 at 126.3μs. When looking at peak performance, the WD Blue SN500 held last again, showing 12,203 IOPS with a latency of 2,452μs.
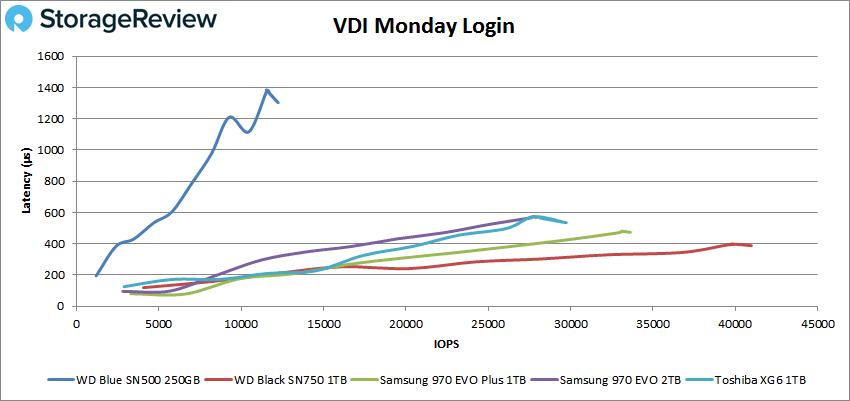
Our last of this series of tests is our VDI Monday Login test. Here, the WD Blue SN500 placed last in both burst and peak performance, showing a 195.3μs latency at burst and a peak performance of 12,241 IOPS with a latency of 1,303.6μs.
Conclusion
The WD Blue SN500 is a single-sided NVMe M.2 SSD designed for client PCs, gaming, and embedded applications. While WD’s “Blue” family has been around for a while, the SN500 is the first of the family that utilizes NVMe technology which aims to give a performance increase of up to three times that of the SATA drives.
When looking at our synthetic workload analyses, the drive placed last in every performance test we put it through, though the WD drives is of a smaller capacity than its comparables. Random 4K Read/Write showed a peak performance of 9,311 IOPS with a latency of 1,171μs, and 21,927 IOPS with a latency of 5,836μs, respectively. Looking at Sequential 64K Read/Write performance, we saw figures of 9,293 IOPS (or 581.9 MB/s) with a latency of 1,717μs, and 5,226 IOPS (or 326.6MB/s) with a latency of 3,046μs, respectively. In our VDI tests, the drive hit 30,251 IOPS with a latency of 1,188μs in boot, 12,203 IOPS with a latency of 2,452μs in initial login, and 12,241 IOPS with a latency of 1,303.6μs in Monday login.
When looking at the SN500, there are two key considerations, performance and price. Overall, while the WD Blue SN500 isn’t the greatest performing drive we’ve seen in the NVMe category, but it may be the least expensive when considering credible SSD brands. And while we didn’t chart out the low-cost QLC SSDs in this review as they skew the results too much, the Blue is a much better choice than the QLC SSDs on the market when it comes to performance. In the end, for users looking to upgrade an older SATA SSD or HDD the WD Blue SN500 may be an ideal candidate where price is the leading decision factor and performance comes secondary. Considering a sub-$55 entry price, the overall package is impressive.
Sign up for the StorageReview newsletter

